Summary
This article describes how to use the Process Monitor tool from Microsoft to diagnose Report Commander report execution problems.
Details
When processing of a report fails due to missing or misconfigured software components (such as database drivers), the error messages returned by the Crystal Reports runtime are often not detailed enough to locate the cause of the problem. In some cases, monitoring Report Commander's file and Registry requests provide more insight into the cause of the problem.
Follow these procedures when requested to do so by support staff.
1. Download the Process Monitor software provided by Microsoft and install it on the computer where Report Commander is running.
2. Start Process Monitor. If the Filter window does not immediately appear, press CTRL-L to display it.
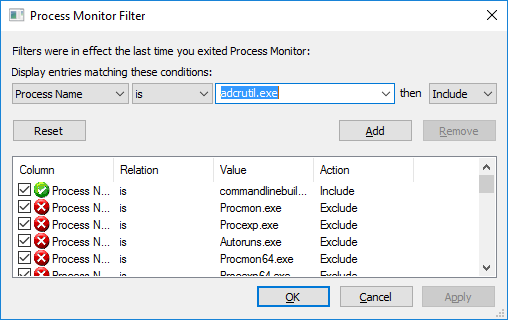
3. In the Filter window, set the following conditions
Display entries matching these conditions: Process Name is [process name] then Include
Specify the correct process name depending on the Report Commander component you are running:
- Command Line Builder: commandlinebuilder.exe
- Command Runner: adcrutil.exe
- Project Editor: projecteditor.exe
- Project Runner: adrcexec.exe
Then click Add to add the filter.
For example:
4. Click OK to close the filter window.
5. Repeat the action in Report Commander that produces the error.
6. In Process Monitor, use File > Save to save the process monitor log using these options:
- Events displayed using current filter
- Also include profiling events
- Native Process Monitor Format (PML)
7. Send the PML file to your support representative.